Edit chart
Loading graph
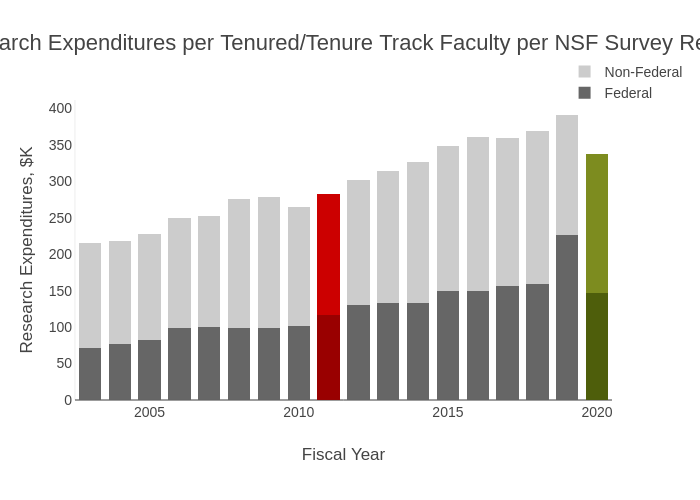
Provostncstate's interactive graph and data of "Research Expenditures per Tenured/Tenure Track Faculty per NSF Survey Results" is a stacked bar chart, showing Federal, Non-Federal, Baseline Federal, Baseline Non-Federal, Goal Federal, Goal Non-Federal; with Fiscal Year in the x-axis and Research Expenditures, $K in the y-axis.. The x-axis shows values from 2002.5 to 2020.5. The y-axis shows values from 0 to 411.57894736842104.